


First of all, Amazon EKS is the managed Kubernetes service you can use from services provided by AWS. It lets you run the Kubernetes clusters without having to worry about all the configurations overhead. AWS manages control plane for your Kubernetes cluster and all you have to do is adding some node groups as EC2 Auto Scaling Group or AWS Fargate. Then, you can actually start running your containerized workloads on a live Kubernetes cluster without too much work.
This is a little information about what is AWS EKS and how you can utilize EKS in your environment. Now, let's talk about the real topic that I want to share today.
What is Prometheus?
So, what is Prometheus and how we can utilize prometheus in a production environment to monitor our application's metrics and also infrastructure health. Not only that, you can also integrate Prometheus with popular open-source tool like Grafana to visualize your metrics and you can get better insights about how your applications are performing in real-time. So, in this blog post, I will demonstrate how to integrate AMP (AWS Managed Prometheus) with our EKS cluster to scrape metric values without installing any agents or scrapers in our cluster.
And after getting necessary metric values, you can also integrate AMP with AWS Managed Grafana service for better visibility of your infrastructure health. So, let's take a look into what steps do i need to perform in order to configure integration between EKS and AMP (AWS Managed Prometheus).
Creating an EKS Cluster with CLI
Creating an EKS Cluster in AWS is pretty simple step and all you've to do is run a command like this ->
eksctl create cluster --name test-eks-cluster --region ap-southeast-1 --fargate
We will create EKS with the serverless fargate profiles for compute resources and not EC2 node groups because it saves cost for our testing purposes.
But the two things you need to configure in your terminal before running this command is ->
Configure your AWS Credentials:
Install awscli in your current terminal. You can check successful installation of your tool with
aws --versioncommand and it should output something like this ->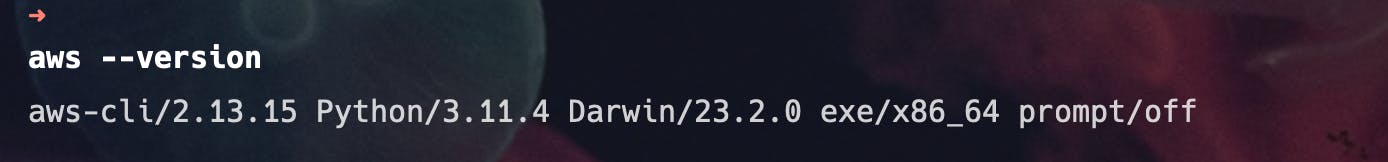
Type
aws configurecommand and when it asks for AWS Access Key ID and AWS Secret Access Key, type in the appropriate credentials that you generated from your IAM user.If you don't know how to get these credentials, you can check out this documentation.
Install eksctl tool in your terminal. And that's it!! Now, you can just type above eksctl command I showed as an example above.
After your command successfully exited and created a default fargate profile and EKS cluster, you need to update your KubeConfig in your shell to access and interact with your EKS cluster.
aws eks update-kubeconfig --name <replace-with-your-cluster-name> --region ap-southeast-1
After updating your kubeconfig file, you can now test your connectivity to your EKS cluster and see if you have correct permissions with kubectl get node command. You should see one default fargate node like this ->

Now, you have a running EKS cluster which you can use to deploy your containerized workloads and start managing them. But the important thing is how do you define and monitor your cluster's health and also your workload's metrics?
The answer is Prometheus!! So, you can use both open-source version Prometheus or AWS Managed Prometheus service. In this post, I will perform with AWS Managed Prometheus service to monitor our cluster health.
Creating Prometheus workspace and Grafana workspace
In this section, we will create necessary workspaces for AWS managed Prometheus and AWS managed Grafana.
Firstly, create an AWS managed Prometheus service from AWS CLI by navigating into AWS Console -> Amazon Prometheus -> Create
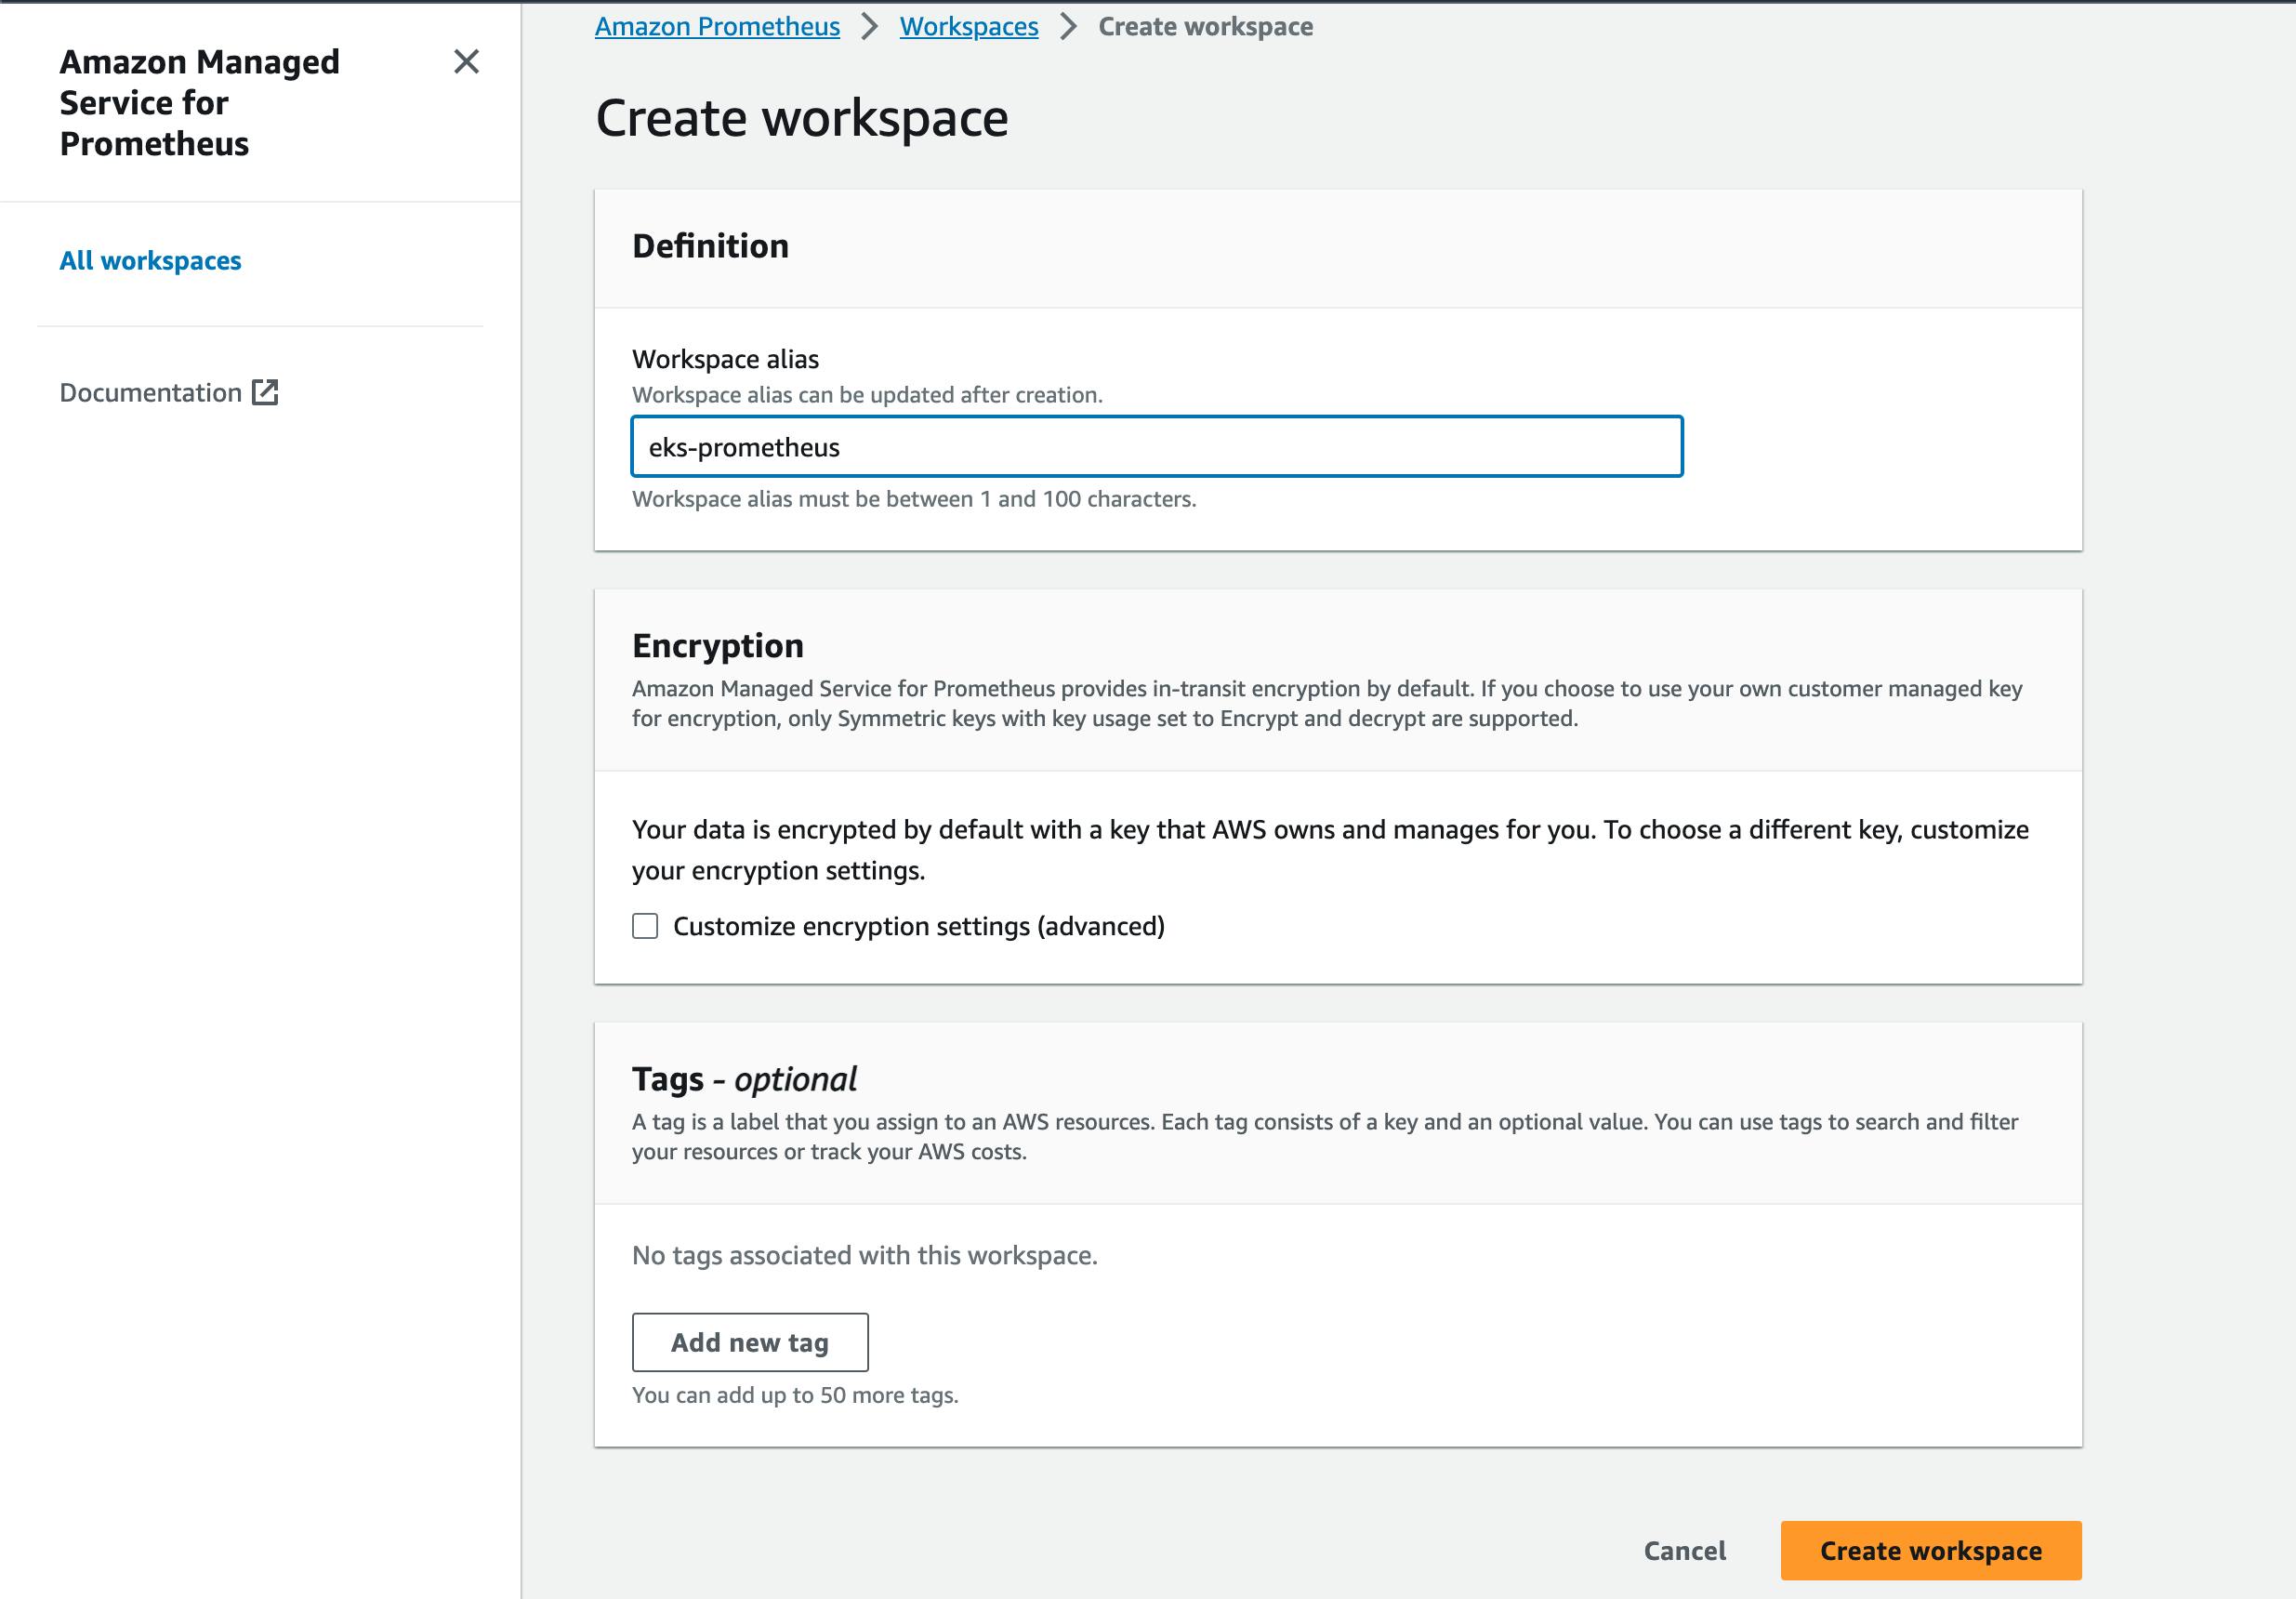
Note down this workspace ARN we created and we will need that information later when we create a scraper for our EKS cluster.
Create a managed Grafana Workspace
The next thing you will need is a Grafana workspace to view and monitor your metrics and also you can setup automated alarm actions in this Grafana dashboard.
To create a Grafana Workspace in AWS go to AWS Console -> Amazon Grafana -> Create Workspace and you will see console configuration like this ->
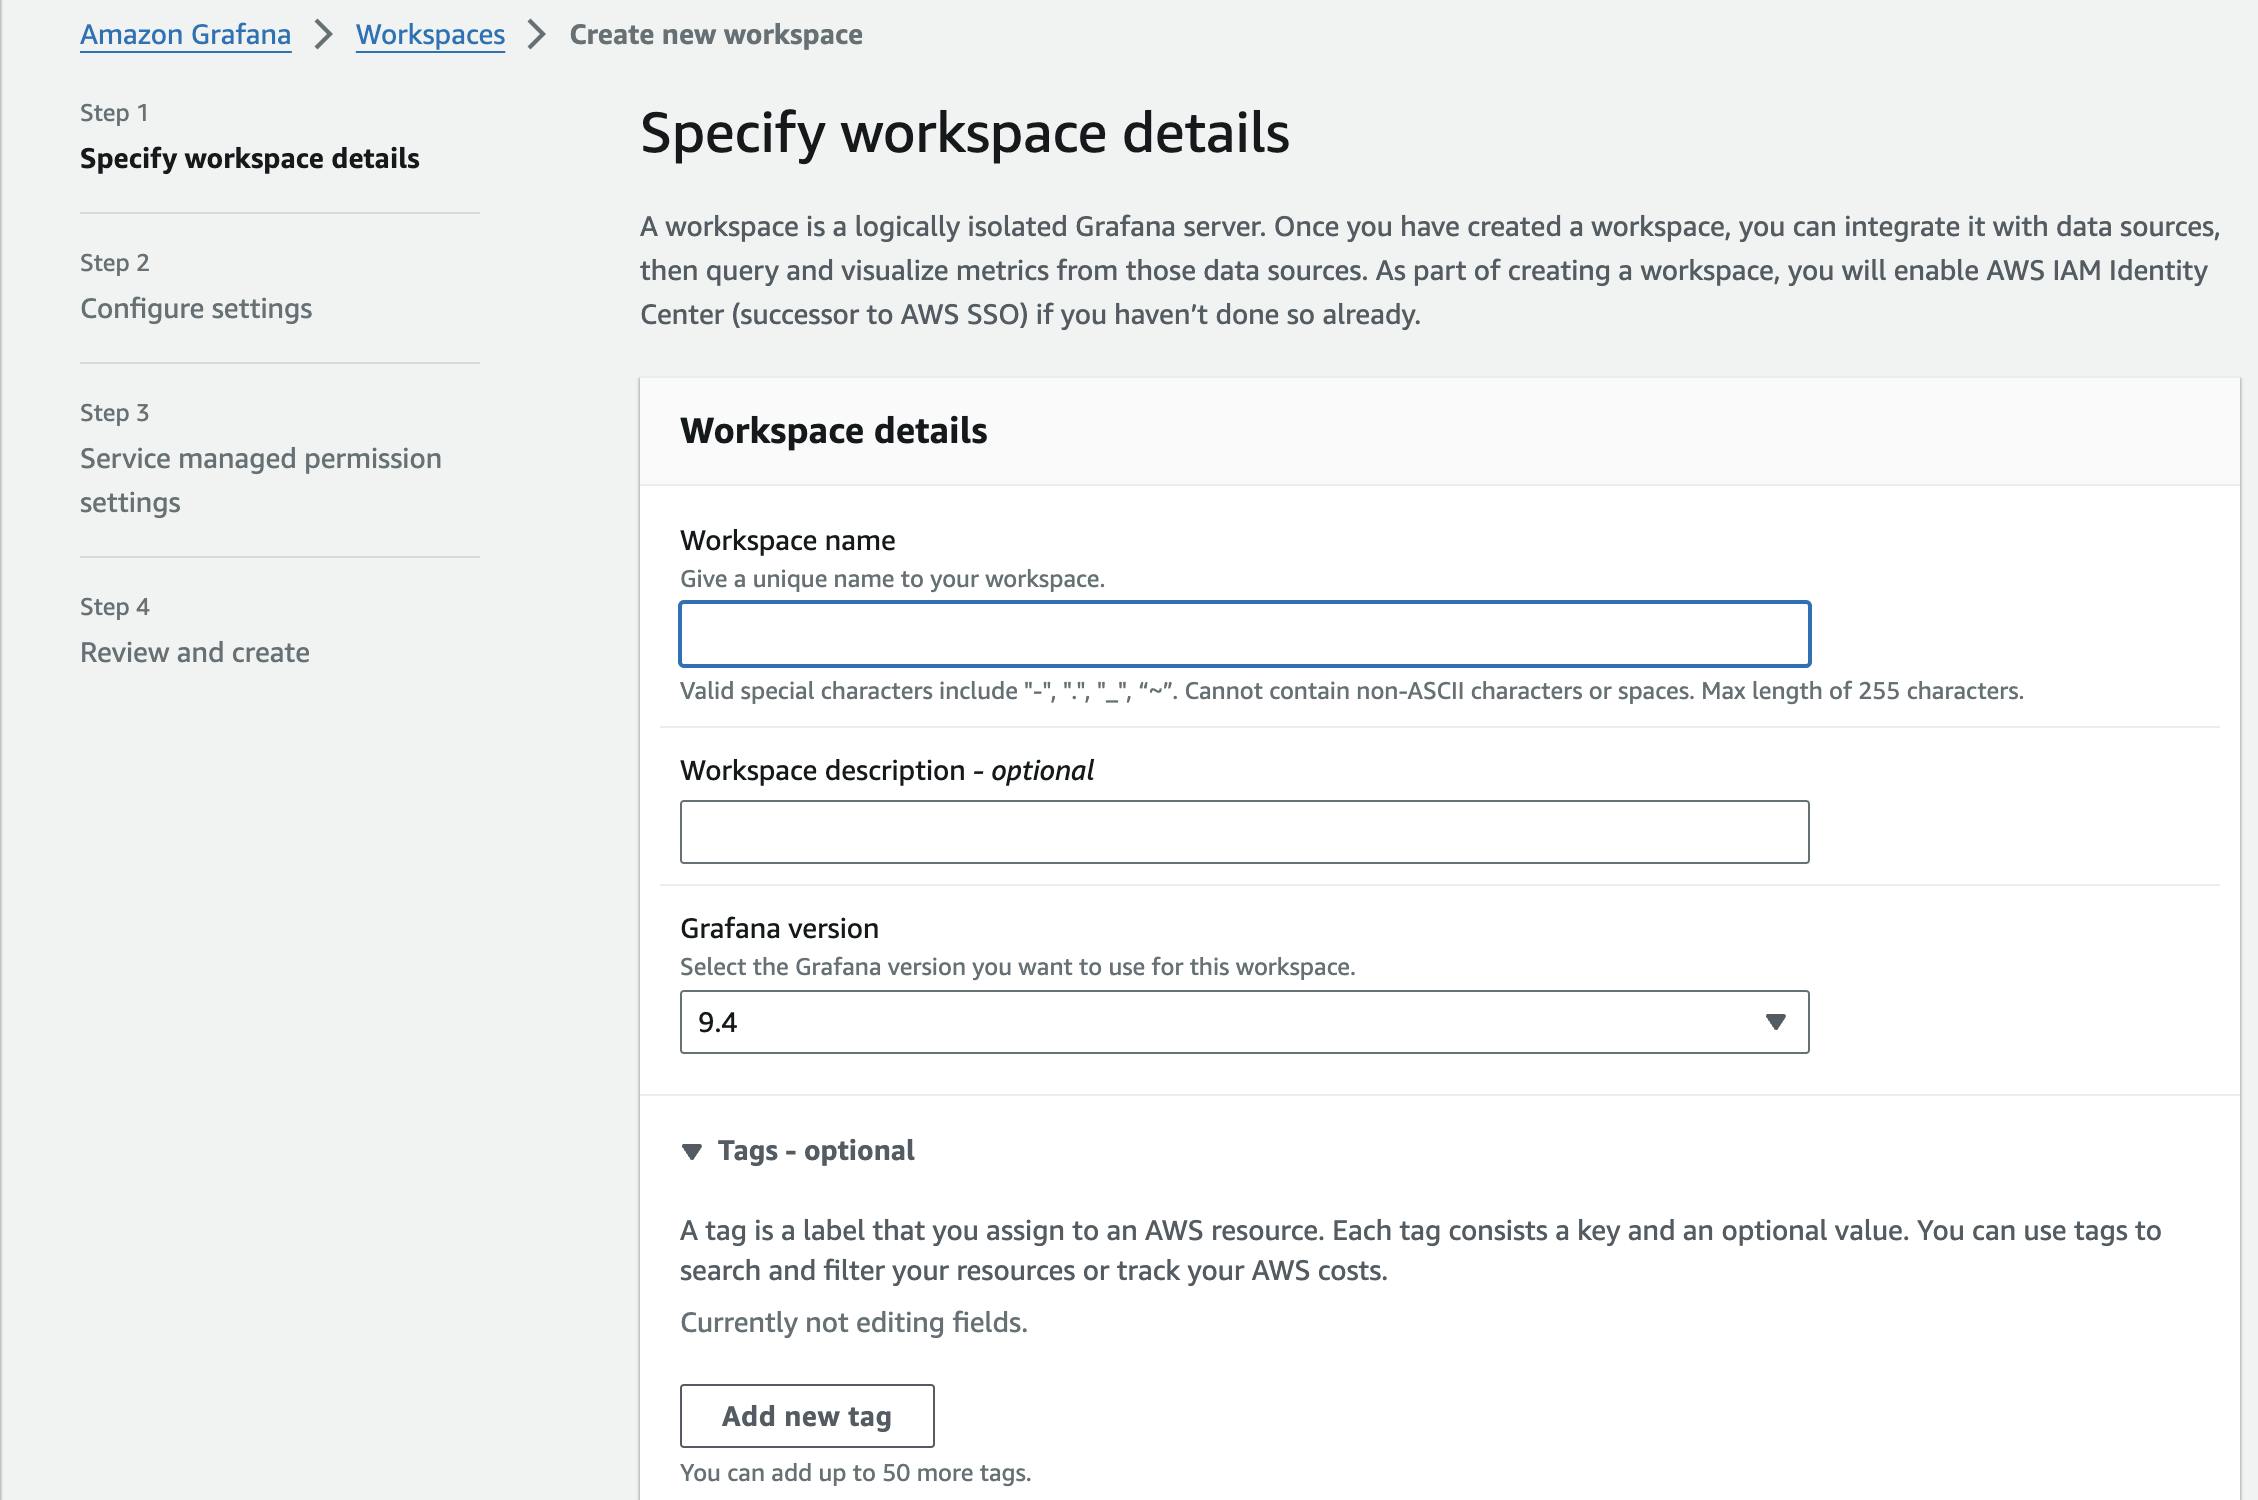
Put in required name and configuration and then create a managed Grafana workspace. You can log into workspace URL with IAM Identity Center credentials and from there, configure data sources to get data from our previously created Prometheus.
Finally, you can create a scraper in your EKS cluster and when your scraper finally sends metrics data into prometheus, you can now visualize and manage observability data in your Grafana Dashboard.
Creating an agentless scraper in your existing cluster
To create an agentless scraper, you need an existing EKS cluster ARN and your AMP ARN. After getting necessary information from your AWS console or CLI, you can create a scraper with following command from CLI ->
aws amp create-scraper \
       --source eksConfiguration="{clusterArn=<EKS-CLUSTER-ARN>,securityGroupIds=[<SG-SECURITY-GROUP-ID>],subnetIds=[<SUBNET-ID>]}" \
       --scrape-configuration configurationBlob=<BASE64-CONFIGURATION-BLOB> \
       --destination ampConfiguration={workspaceArn="<WORKSPACE_ARN>"}
Other than ARNs of your resources, you will see you also need configurationBlob in your command to execute create-scraper command. It is nothing but base64 encoded version of your prometheus config file. So, you need to encode your config file and then pass it to your command execution. You can use base64 -i sample-configuration.yml | pbcopy this command to copy your blob to clipboard suppose you have configuration file named sample-configuration.yml in your current directory.
After successfully created your scraper, the scraper will actually pull the prometheus metrics from your EKS cluster and then push to your AMP workspace. From there, you can visualize and observer your infrastructure and application's metrics.
Summary
In this blog post, I've performed how to create an EKS cluster from CLI quickly and how to set up and use AWS Managed Prometheus service to monitor and visualize your cluster's health metrics. So, if you are a seasoned DevOps engineer or a fresh monitoring engineer, you can get use of AWS services to better understand your infrastructure's health and application's metrics without having to worry about configuration much.
If you want to follow along, you need an AWS account and required credentials to test along with me for this implementation. Amazon EKS is not free so you have to pay a cent or two for testing and creating an EKS cluster in your account. But other than that, I think you will be just fine testing along with me because I've performed step-by-step details.
If you have any questions related to this topic, you can reach out to me in Hashnode account Hein Htet Win or at twitter X, Heinux. Thank you all for reading.